


How Does Disney Deal with Money Problems at Their Theme Parks?
By Joanne Cassar / 06. Sep 2025
read more
By Joanne Cassar / 26. Oct 2022

IC Markets - Regulated By FSA
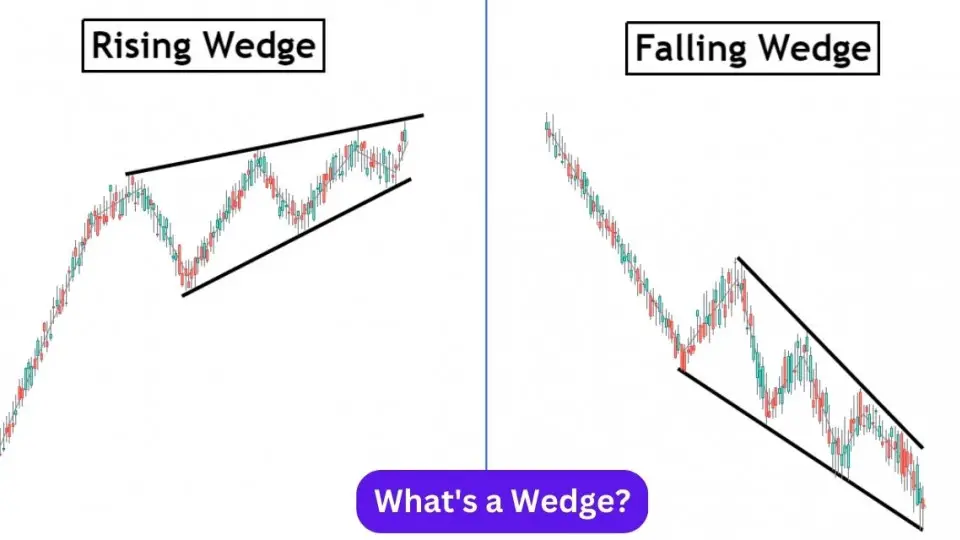
A wedge pattern is a type of market trend that can be seen on a technical analysis chart (stocks, bonds, futures, etc.).
The pattern is made up of a narrowing price range and either an upward price trend (called a rising wedge) or a downward price trend (known as a falling wedge).
A pattern that forms at the top or bottom of the trend is called a "wedge pattern." It is a type of formation in which trading takes place along straight lines that come together to make a pattern. The wedge should take about 3 to 4 weeks to finish.
This pattern has a rising or falling slant that points in the same direction. It's not the same as a triangle because both of its sides either go up or down.
The price breaking out of the triangle is another difference. The falling and rising of wedges is only a small part of the major or intermediate trends.
They are not considered major patterns because they are only used for small trends. Once that main or basic trend starts up again, the wedge pattern is no longer a good technical indicator.
When stock prices have been rising up for a certain amount of time, two trend lines that meet form a rising wedge.
Before the line converges in the middle, sellers enter the market, which slows down the prices.
This causes the prices to break from the upper or lower trend lines, but most of the time the prices break from the trend line in the opposite direction.
Depending on where the rising wedges are, the direction of the trend will either continue or change:
When stock prices have been falling down for a certain amount of time, two trend lines meet to form a "falling wedge."
Before the line meets, buyers start to enter the market. As a result, the price drop starts to slow down.
Because of this, the prices move away from the upper trend line. Depending on where the falling wedges land, it shows if the trend will continue or change:
The Rising and Falling Wedge pattern is shown in the uptrend and downtrend below:
The Sundaram Finance Ltd. Daily chart shows an example of a Rising Wedge that formed in a downtrend.
The line below that meets in the middle is called the support line. When the prices break through the support line, the downtrend is sure to keep going.
Stop-loss can be put on the rising wedge line at the top.
The price goal is the same as the height of the wedge's back.
When prices break above the upper trend line that is coming together, traders should buy.
Stop-loss can be put at the bottom of the line, which looks like a falling wedge.
The price goal is the same as the height of the wedge's back.
Wedge patterns are often reversal patterns. A rising wedge is bearish, while a falling wedge is bullish.
These patterns can be hard to spot and understand on a chart because they look like triangle patterns and don't always form cleanly.
So, it's important to be careful when trading wedge patterns and to use trading volume to confirm a suspected breakout.


By Joanne Cassar / 25. May 2025
read more